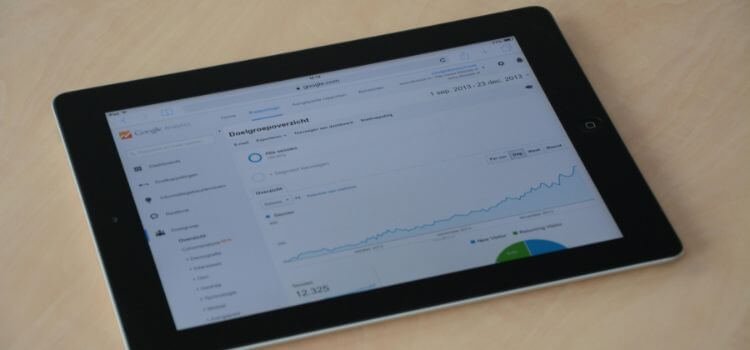
Web analytics is a powerful tool that can completely transform your website’s performance. By tracking how visitors interact with your site, you can uncover valuable insights that help you make informed decisions. From improving user experience to increasing conversions, web analytics gives you the data you need to succeed.
For example, imagine knowing why visitors leave your site or which pages drive the most engagement. With web analytics, you can fix issues and build on your successes. It’s not just about numbers—it’s about using those numbers to create a better experience for your audience.
In this guide, you’ll learn practical ways to use web analytics, just like I did to improve my website’s engagement by 40%. If you’re ready to take control of your website’s performance, let’s explore how web analytics can make a difference.
Table of Contents
ToggleWhat is Web Analytics?
Web analytics refers to tracking, measuring, and analyzing website data to understand user behaviour and improve website performance. It answers critical questions like:
- Who is visiting your site?
- What are they doing?
- Why are they leaving?
A common example is using Google Analytics to track metrics such as bounce rates, conversion rates, and traffic sources. For instance, when I analyzed my blog, I found that 80% of visitors came from mobile devices. This insight led me to optimize the site for mobile users, boosting session time by 25%.
By leveraging web analytics, businesses can identify weaknesses and opportunities. Think of it as your website’s health report—it highlights what’s working and what needs improvement.

Top Pillars of Web Analytics
Web analytics rests on five critical pillars that form the foundation of its effectiveness. Each pillar plays a vital role in enhancing your website’s performance.
Data Collection
Web analytics starts with implementing tracking codes (like JavaScript or pixels) to capture user interactions. Tools such as Google Analytics or Adobe Analytics are commonly used. These tools gather data like:
- Page views
- Clicks
- Session duration
Integrating additional data sources like CRM systems can offer a holistic view of user activity.
Data Measurement
Key performance indicators (KPIs) like bounce rates, conversion rates, and click-through rates help measure website success. For example:
- A 60% bounce rate means many visitors leave after one page.
- Conversion rates of 3% indicate three out of every 100 visitors take action.
Data Analysis
Data analysis involves examining collected data to uncover trends, patterns, and actionable insights. For example, I noticed one of my landing pages attracted high traffic but had low conversions. By analyzing user behavior, I realized the call-to-action (CTA) wasn’t clear enough.
After making simple tweaks, like changing the wording and button placement, the conversion rate increased by 15%. This shows how understanding your data can help you make strategic changes that significantly improve website performance.
Reporting and Visualization
Reporting and visualization transform raw data into easy-to-understand formats like charts, dashboards, and graphs. These tools make it simpler to identify trends, monitor performance, and communicate findings effectively.
For example, I once used a dashboard to display real-time website traffic during a campaign. The visual data made it clear which channels were driving the most visitors, enabling quick adjustments to improve results. Clear and compelling visualizations empower stakeholders to make informed, data-driven decisions with confidence.
Continuous Improvement
Continuous improvement is key to maximizing the value of web analytics. It’s not a one-time process but an ongoing cycle of analyzing data, testing strategies, and refining your approach. For example, I regularly review website metrics to spot trends and test changes like new page layouts or updated CTAs.
These small adjustments often lead to big improvements, such as increased engagement or higher conversion rates. By staying proactive and consistently optimizing, you ensure your website remains competitive and effective.

The 4 Stages of Web Analytics
Web analytics follows a structured process comprising four stages. Let’s discuss in detail:
1. Collection and Storage
The collection and storage of data are the foundation of web analytics. Here’s how it works:
- Tracking Codes: Embedded JavaScript or pixel codes capture user interactions, such as page views and clicks.
- Website Data: Information like session duration and navigation paths is gathered directly from your site.
- Marketing Tools: Data from email campaigns, ad platforms, and CRM systems is integrated for a complete overview.
- Analytics Platforms: Tools like Google Analytics store and process this data, creating a centralized location for analysis.
2. Processing and Analysis
Collected data is analyzed using statistical and advanced techniques like A/B testing or heatmaps. Insights reveal how users interact with your website and where improvements are needed.
Key steps include:
- Statistical Techniques: Metrics like bounce rates and conversion rates are calculated to assess performance.
- Advanced Methods: Tools such as A/B testing identify the most effective strategies, while heatmaps highlight user behaviour on specific pages.
- User Interaction Insights: Analysis reveals how visitors navigate your website, pinpointing areas where they drop off or lose interest.
- Improvement Opportunities: These insights guide strategic changes to enhance user experience and boost overall performance.
3. Reporting and Visualization
Transform data into visual formats like dashboards or pie charts. For example, I use Google Data Studio to share weekly website performance reports with my team.
Reporting and visualization turn complex data into clear, easy-to-digest formats. Key approaches include:
- Visual Formats: Use dashboards, pie charts, and graphs to present data effectively.
- Example Tools: Platforms like Google Data Studio enable you to create detailed reports for better decision-making.
- Team Collaboration: Sharing visual reports helps align teams by presenting key metrics at a glance.
- Actionable Insights: Well-structured visuals make it easier to identify trends and areas for improvement, leading to informed strategies.
4. Utilizing Insights
Applying insights from web analytics is the final and most impactful stage. Here’s how you can use data to drive improvements:
- Identify Issues: Pinpoint problems, such as high bounce rates or low engagement on specific pages.
- Strategic Adjustments: Address issues like slow loading times for mobile users or unclear CTAs to improve user experience.
- Optimize Performance: Use insights to enhance navigation, content, or speed, ensuring visitors stay longer and convert more.
If analytics show mobile users leave due to slow speeds, optimizing for faster loading can boost engagement significantly.

How to Use Web Analytics Effectively
Using web analytics effectively means more than gathering data—it’s about transforming that data into actionable insights. Here’s a step-by-step guide to help you improve your website’s performance using web analytics tools.
Define Objectives and KPIs
Start with clear goals. What do you want to achieve? Are you aiming for more sales, higher engagement, or better traffic retention? Clear objectives help you focus on the metrics that matter. For instance, you might set a goal to increase conversions by 10% in the next month. Key Performance Indicators (KPIs) like bounce rates, conversion rates, and traffic sources will guide your analysis.
Set Up Tracking Tools
Having the right tools in place is crucial. Google Analytics is a popular choice, and Google Tag Manager simplifies tracking code integration without advanced coding skills. These tools allow you to track essential user behaviours such as page views, clicks, and session durations. Once, I used Google Analytics for a client’s e-commerce site and discovered that 60% of their traffic came from Instagram, which helped us refocus marketing efforts.
Analyze the Data
This is where you uncover patterns and trends. Pay attention to metrics like traffic sources, popular pages, and bounce rates. For example, if you see a sudden drop in traffic, analyze if it coincides with a slow-loading page or outdated content. Understanding user behaviour helps you address pain points and capitalize on strengths.
Take Action Based on Insights
Data without action is just numbers. Use your findings to optimize your website. For instance, if analytics reveal users are abandoning the checkout process, simplify it. Streamline steps, add trust signals, and ensure the process works smoothly on mobile devices. Once, a small tweak I made to a client’s checkout button improved their sales by 15%.
Monitor Progress Regularly
Tracking your performance isn’t a one-time task. Review your analytics weekly or monthly to measure progress against your goals. For example, I set a goal to improve blog engagement by 20% in three months and tracked the bounce rate weekly to adjust strategies as needed.
Refine and Test Strategies
The digital world is always evolving, so your strategies should too. Run A/B tests to see what works best, whether it’s a new landing page design or a revised CTA. Regular testing ensures your website stays effective and relevant.
By following these steps, you’ll unlock the full potential of web analytics, making informed decisions that drive measurable improvements and boost user experience.
What Insights Can Web Analytics Provide?
Web analytics offers powerful insights to help businesses thrive. Here are some key takeaways:
- User Behavior: Understand how users navigate your website.
- Content Effectiveness: Identify which pages perform well and which need improvement.
- Audience Segmentation: Discover your audience’s demographics and preferences.
- Conversion Optimization: Pinpoint barriers in the conversion funnel.
For instance, when I segmented my audience by location, I noticed visitors from urban areas preferred video content. This insight led me to create more video tutorials, resulting in a 30% increase in engagement.
Web Analytics vs. Data Analytics
While web analytics focuses on website data, data analytics covers a broader scope. Here’s a quick comparison:
| Aspect | Web Analytics | Data Analytics |
|---|---|---|
| Scope | Tracks website-specific metrics | Analyzes data from diverse business sources |
| Purpose | Optimizes website performance | Enhances overall business strategy |
| Tools | Google Analytics, Adobe Analytics | Power BI, Tableau, Hadoop |
Understanding these differences can help you use each discipline effectively. For example, while web analytics improves user experience, data analytics might guide inventory decisions for an e-commerce business.

Key Tools for Web Analytics
Several tools can help you master web analytics. Let’s break them into free and paid options:
Free Tools
- Google Analytics: Comprehensive tracking for beginners.
- Hotjar: Heatmaps to visualize user activity.
Paid Tools
- SEMrush: Competitive analysis and SEO insights.
- Crazy Egg: Advanced heatmaps and A/B testing.
When I started, I relied heavily on Google Analytics. As my projects grew, investing in premium tools like SEMrush significantly boosted my strategies.
Web Analytics for Continuous Growth
Web analytics isn’t just about analyzing data—it’s about driving results. For instance:
- Reducing page load time by one second can increase conversions by 7%.
- Tracking mobile vs. desktop traffic can guide design improvements.
One of my favourite success stories is when I helped a local retailer track campaign performance. By focusing on traffic sources, they realized Facebook ads drove 70% of conversions. This insight helped them double their ad spend on Facebook, resulting in a 40% revenue increase.
The Future of Web Analytics
Web analytics is evolving rapidly. Here are some trends shaping its future:
- AI-Powered Insights: Tools like Google Analytics 4 use AI to provide actionable recommendations.
- Privacy-Centric Tracking: With GDPR and similar regulations, privacy-compliant analytics tools are essential.
- Predictive Analytics: These tools forecast trends, enabling proactive strategies.
As the digital landscape changes, staying updated ensures your website remains competitive. Embrace these advancements, and you’ll be ahead of the game.
Frequently Asked Questions
What is web analytics?
Web analytics is the process of tracking and analyzing website data to understand user behavior and optimize website performance. It helps identify trends, measure success, and make data-driven improvements to enhance user experience and achieve business goals.
Why is web analytics important for my website?
Web analytics provides insights into how visitors interact with your site, helping you pinpoint areas for improvement. It allows you to enhance user experience, improve content strategies, and boost conversion rates, making it an essential tool for website optimization.
Which tools are best for web analytics?
Popular tools like Google Analytics, Adobe Analytics, and Hotjar are excellent for tracking website performance. These platforms offer features such as traffic analysis, user behaviour tracking, and conversion monitoring to help you make informed decisions.
How does web analytics improve website performance?
By analyzing key metrics like bounce rates, session duration, and conversion paths, web analytics helps identify strengths and weaknesses. These insights guide adjustments to your design, content, and strategies, resulting in improved engagement and conversions.
Is web analytics suitable for small businesses?
Absolutely. Web analytics is a cost-effective way for small businesses to understand their audience and optimize their websites. Tools like Google Analytics are free and provide valuable data to help small businesses grow online.
Conclusion
Using web analytics is a game-changer for optimizing your website performance. It provides valuable insights into user behaviour, showing what’s working and what needs improvement. By leveraging web analytics, you can make data-driven decisions to enhance user experience, boost engagement, and increase conversions.
From tracking metrics like bounce rates and traffic sources to refining strategies based on real data, web analytics helps your website reach its full potential. Businesses that embrace web analytics often see significant growth and better ROI. Start using these tools today, and watch your website thrive like never before!
This post contains affiliate links. I may earn a commission if you make a purchase through them, at no extra cost to you.


